Tips and Tutorials \ Tips for QGIS
Top 10 tips to enhance QGIS experience !
Type: How-To
Categories: Visualization Tools
QGIS : Top 10 tips to enhance QGIS experience !
QGIS can be a little overwhelming in the beginning. Here are some tips to improve your QGIS skills and experience. This tutorial covers large use cases, from raster/vector manipulation, layer organization, layer styling to use of plugin, and more.
1 - Useful panels to have a clear overview of your work
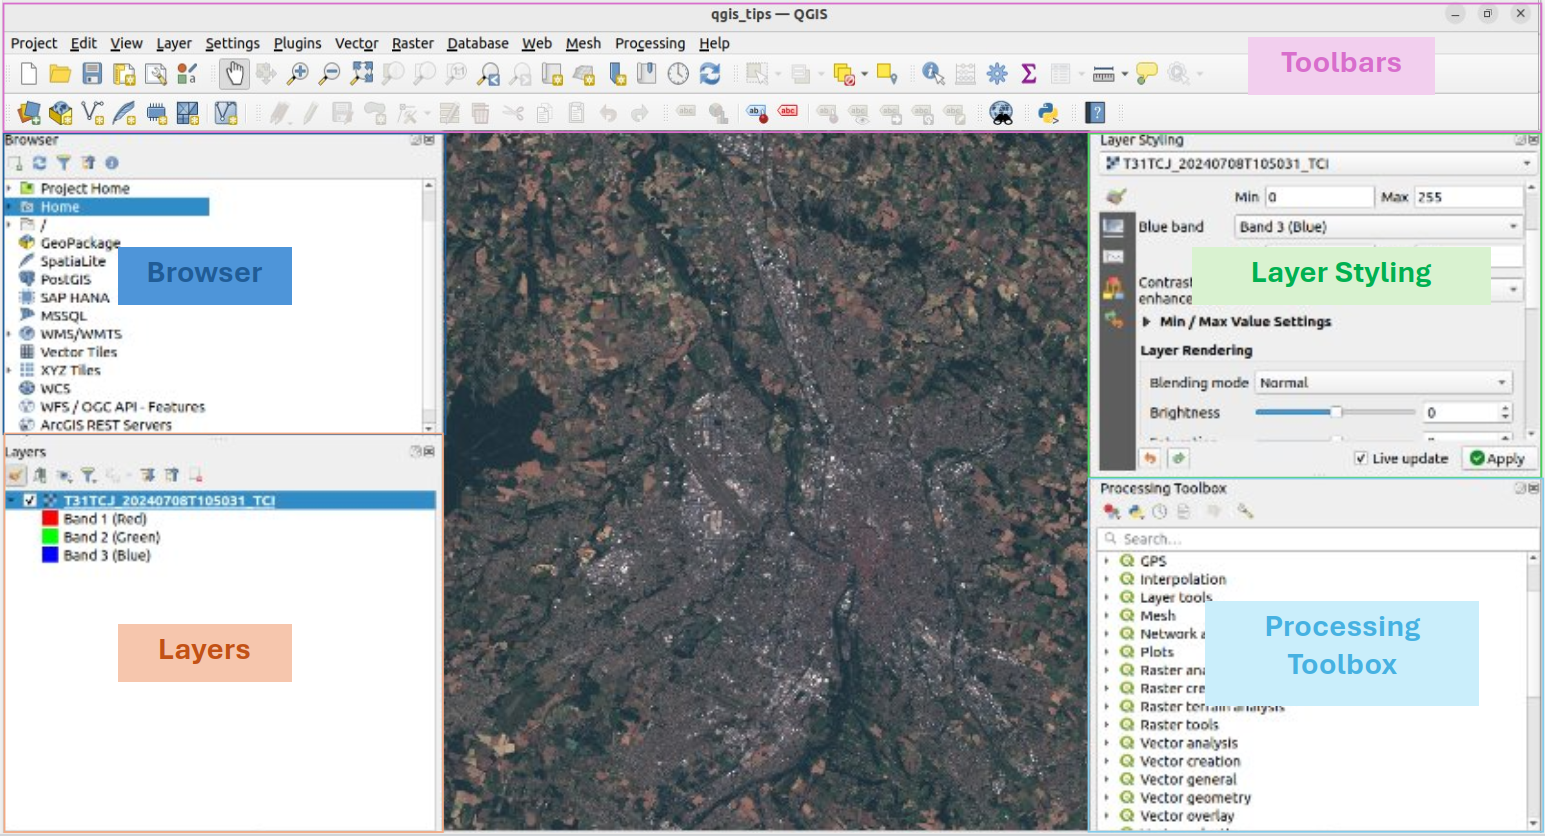
By default when you open QGIS three panels are displayed, in addition of the toolsbar : 'Browser', 'Layers' and 'Layer Styling'. They allow you to open, manage and style layers.
You can activate hidden panels by clicking on the menu: "View"->"Panels" and activate missing panels. I suggest to activate 'Processing toolbox' to obtain 4 new panels.
What they do:
-
Browser : open layers (raster or vector) from your local storage system, database and online connexion (XYZ, WCS, WMS...), add directories to favorites
-
Layers : manage and organize layers in your project; activate and move layers, gather them in groups
-
Layer Styling : symbology, transparency, histogram, etc. You can also access "layer styling" by double-clicking on the layer
-
Processing toolbox : launch various processing tools from QGIS (GDAL, OTB...)
Furthermore, you can hide all panels with the shortcut Ctrl+Tab, it will display current view in the entire QGIS window (... and redisplay them with the same shortcut!).
You can have additional information on the panels section from QGIS documentation.
2 - Apply a style to a layer
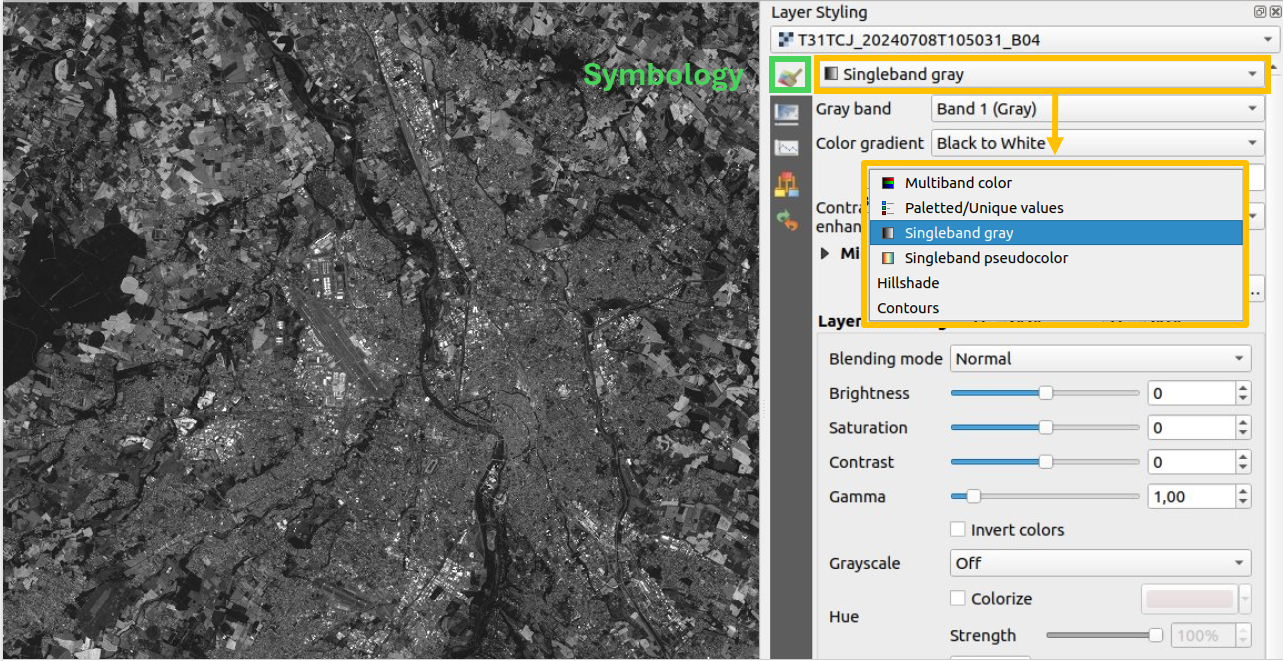
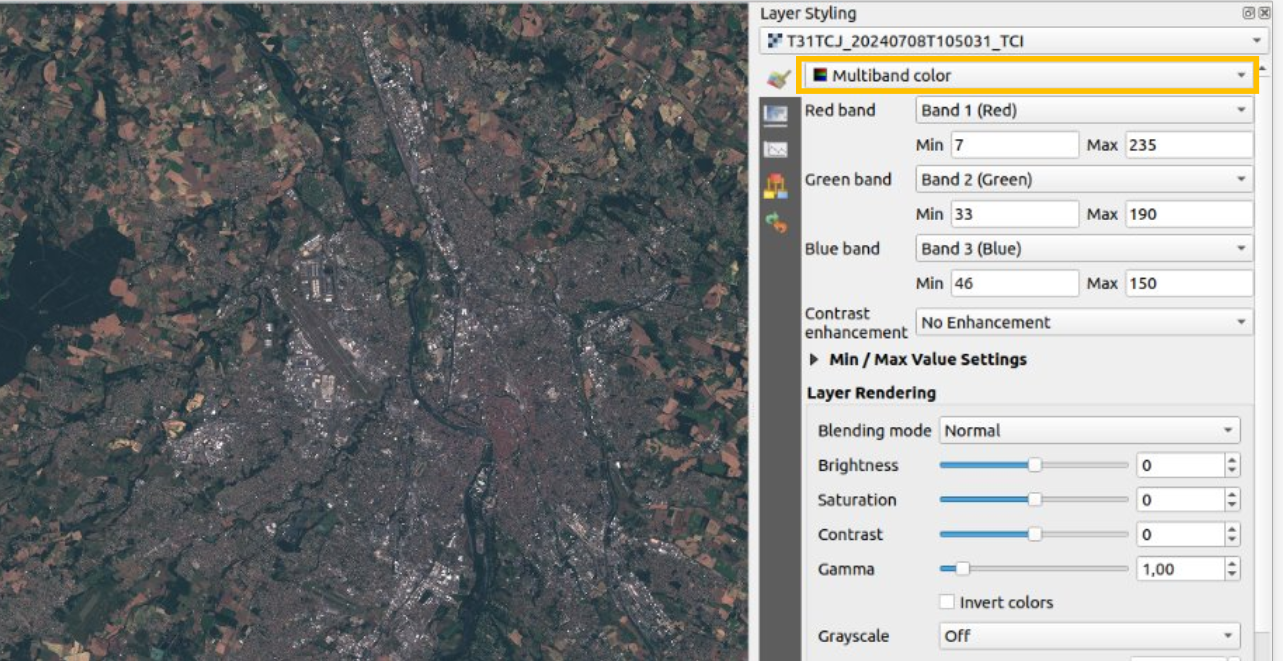
Symbology section in Layer styling panel allows to easily configure layer rendering. Several options are available depending on the source of your layer:
Singleband or multiband color (RGB) to display images:
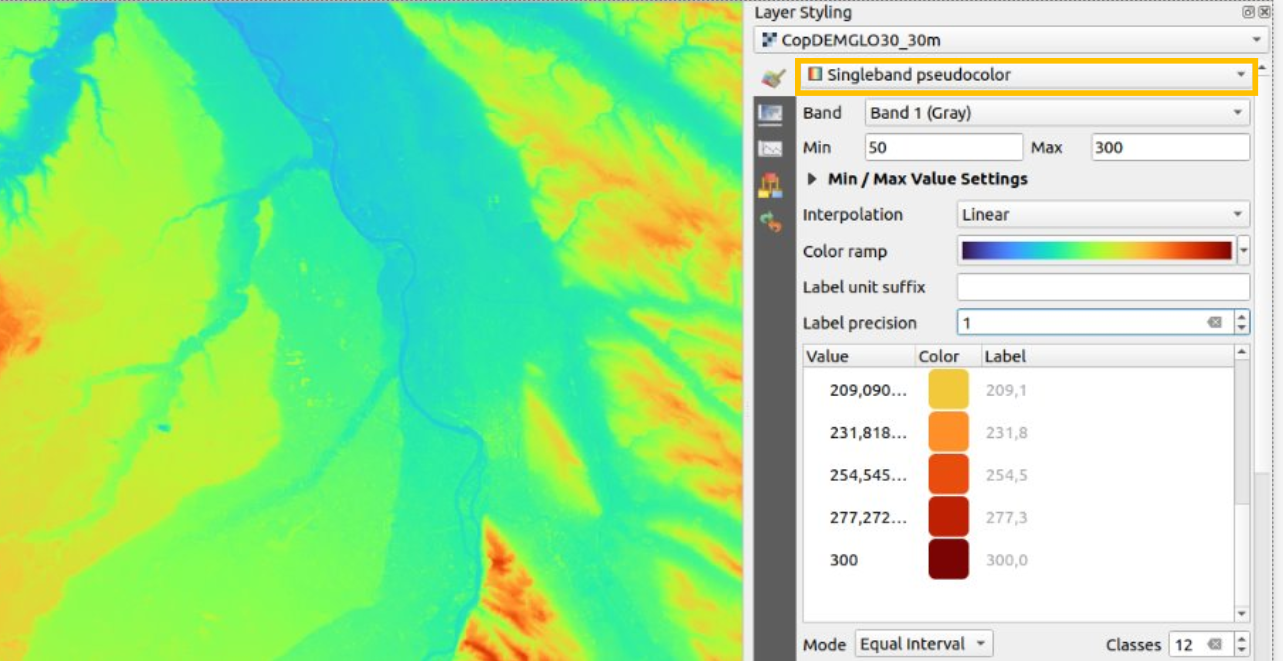
Singleband pseudo color to display a DEM:
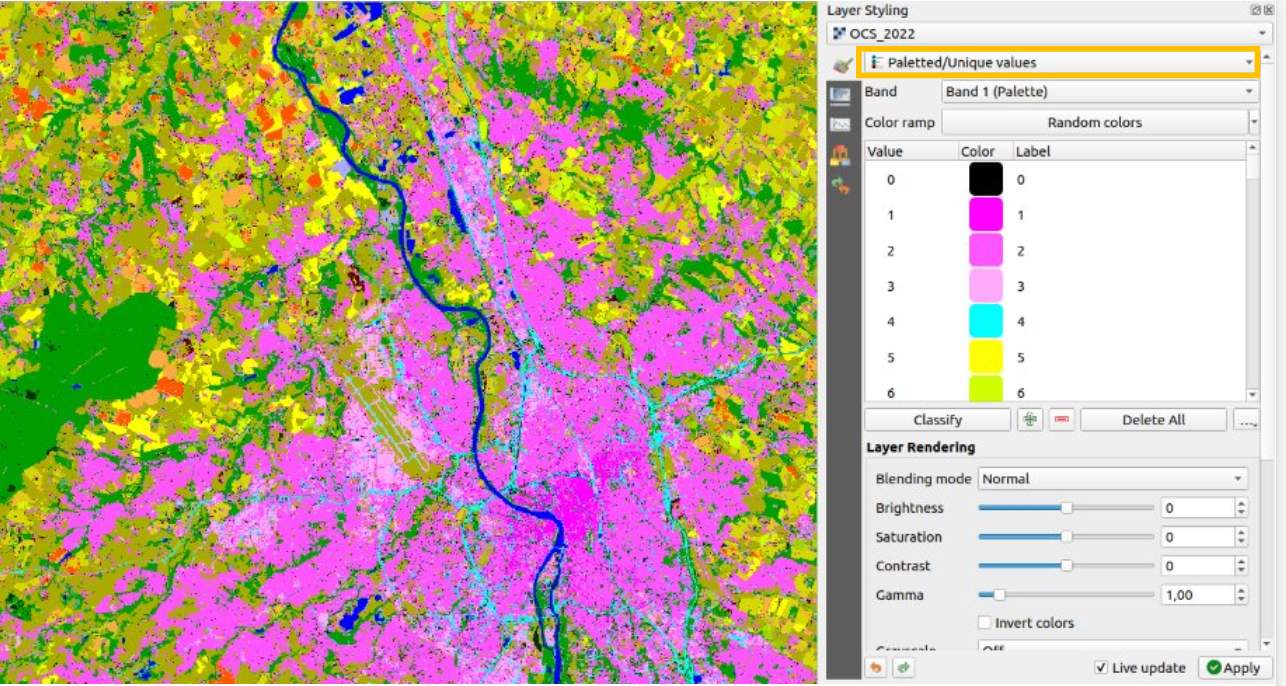
Paletted / unique values to display classification layer (land cover mask for example):
3 - Tune min/max values
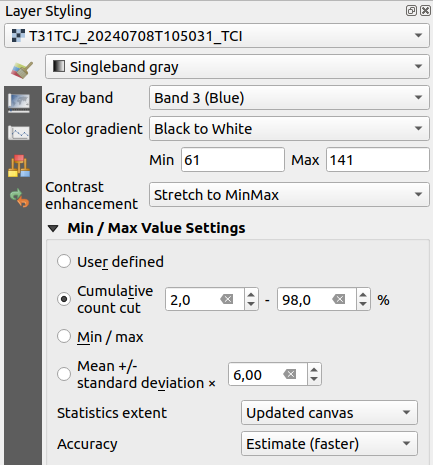
To go further, the symbology section allows you to tune min/max values. By default the min/max values are estimated on the whole raster. But depending on your needs, you may change the min/max manually or adapt it automatically. Several options are available :
- User defined : Selected automatically when you manually change min/max field.
- Cumulative count cut : Default 2% to 98%, allows you to remove extreme values.
- Min/max : Min / max computed on the layer.
- Mean +/- standard deviation: Computes mean and sets min/max depending on standard deviation. Also removes extreme values.
You can change how those statistics are computed, on the whole raster, current canvas view or updated canvas (updated each time you change the canvas view).
Accuracy can be changed from Estimate to Actual but it can take long depending on your image size.
4 - Copy/Paste style from one layer to another
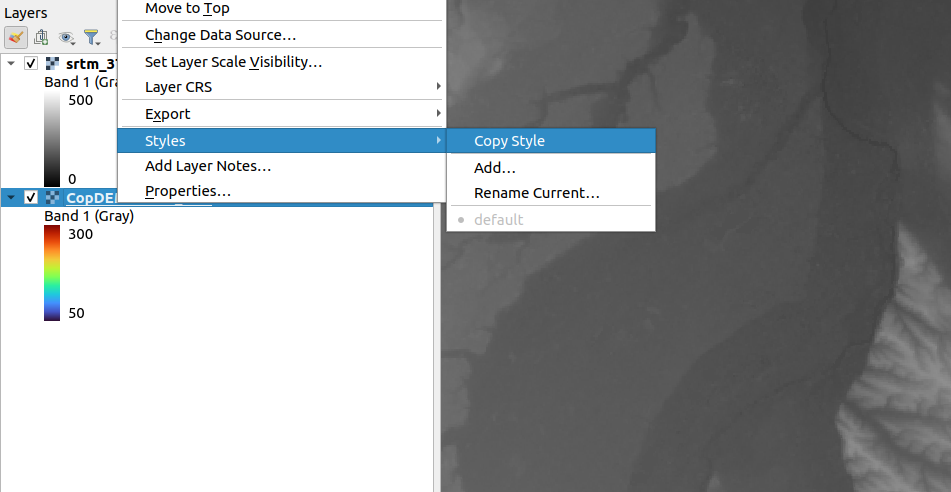
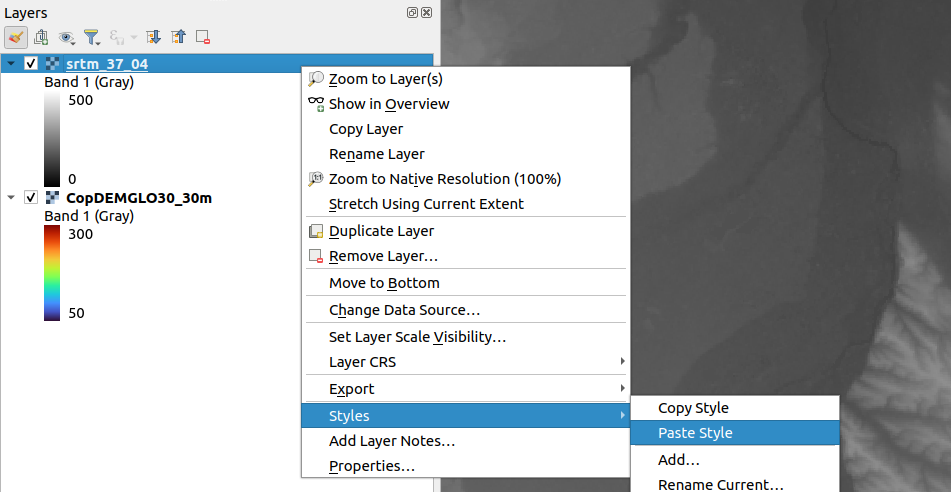
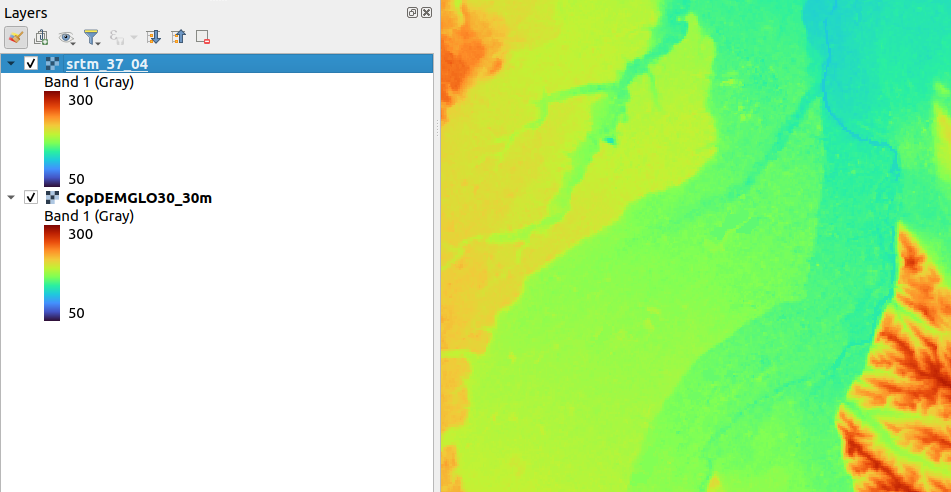
You can copy/paste a style created previously (thanks to tips 2 and 3) in the Layers panel. First, right-click on the desired layer, then click on "style"->"copy style" or "paste style".
Below is an example with a copy of singleband pseudocolor style from a Copernicus DEM pasted to a SRTM DEM in Toulouse, France.
5 - Install plugins
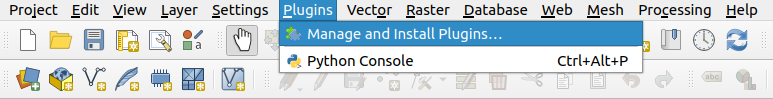
Plugins built by the QGIS community extend the basic functionnalities of QGIS. It is quite easy to install a plugin in QGIS: click on "Plugins" from the main toolbar and click "Manage and install plugins...".
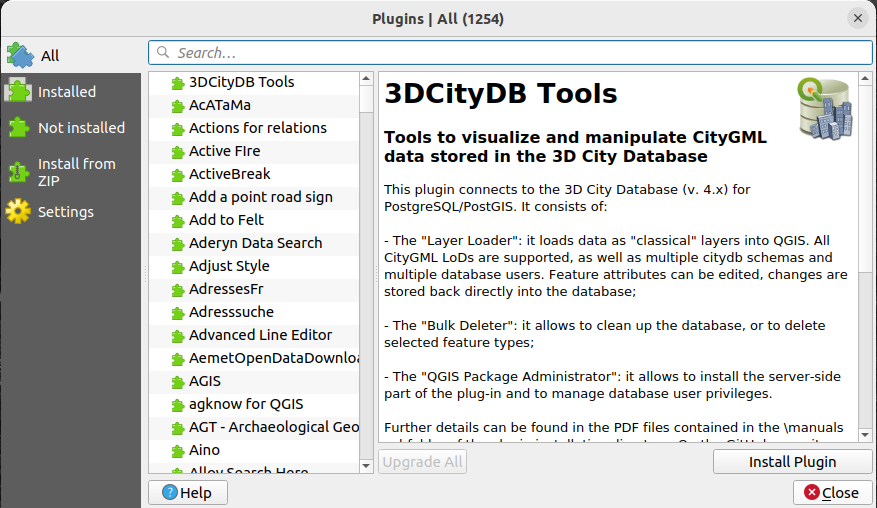
The plugin handle menu contains five sections : - The "All" section lists all the plugins detected by QGIS (installed or not installed) and allows you to install, deactivate or remove plugin. - "Installed" and "Not installed" sections filter the list of plugins present in "All" section. - You can manually install plugins from zip packages in the "Install from ZIP" section. - The "Settings" section allows you to tune plugin parameters, mainly to add other plugin repositories.
6 - Organize layers in groups
As you add layers into your project, it can become troublesome to find them. Moving layers around is limited when your project grows bigger. A solution is to organize your project with groups to arrange layers by product, date, type...
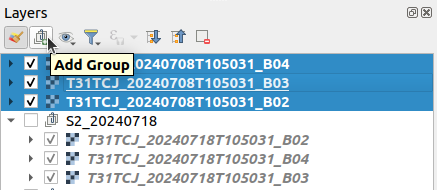
First, select the layers you want to group on the "layers panel" (hold ctrl and click on the layers). Then, to group your layers in the "layers" panel you have two options:
-
Click on the button "Add group" on the "layers" panel toolbar;
-
Right click on one of the layers selected and click on "Group selected".
Below is an example of creating a group by clicking the "Add group button":
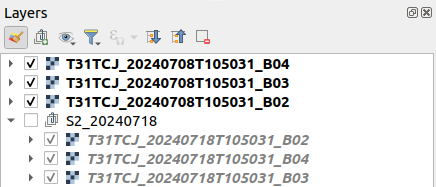
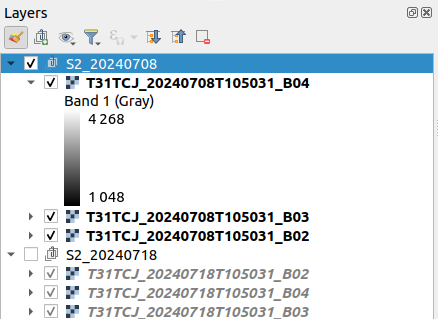
You can rename and move groups and create sub-groups on multiple levels.
7 - Using the processing Toolbox panel
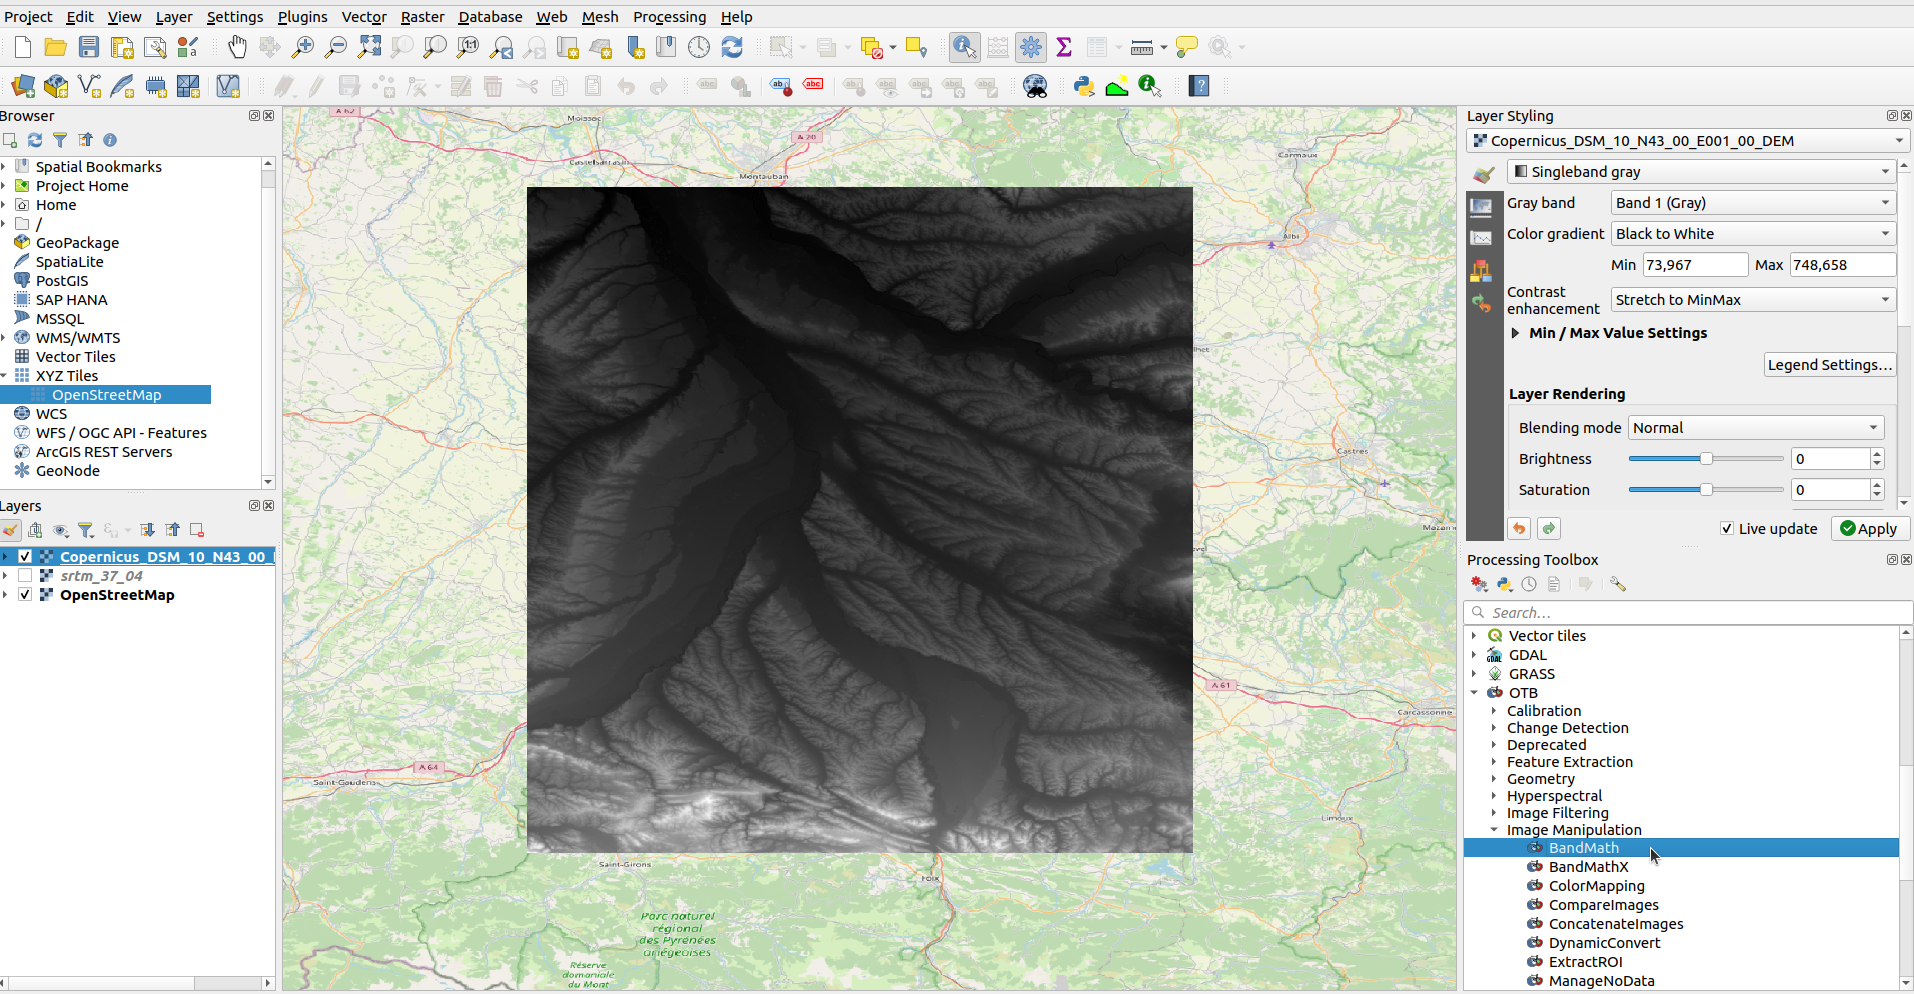
The processing Toolbox panel shows available algorithms from all the providers like GDAL, OTB or GRASS (you can extend it by adding other providers). It allows you to run algorithms with a friendly GUI !
Let's take an example with a classical OTB application, BandMath, that computes a mathematical operation on multi-band images. If OTB is not set up in QGIS you can follow this tip.
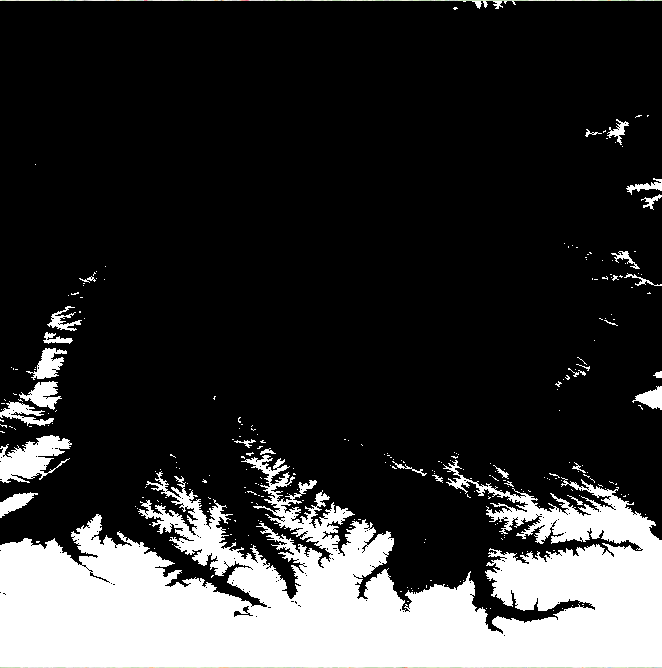
This example takes a Copernicus DEM in Toulouse, France, and filters pixels above 300 meters.
To run bandmath, double click on "OTB"->"Image Manipulation"->"BandMath" in the Processing Toolbox panel.
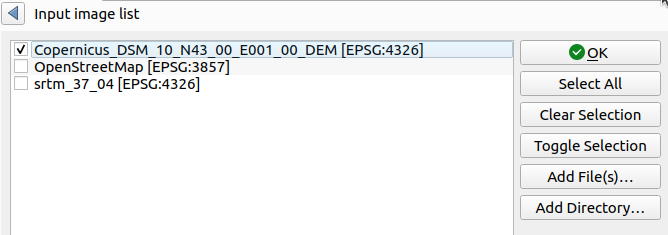
Then a window opens where you can select input images, write your mathematical expression and write the output image.
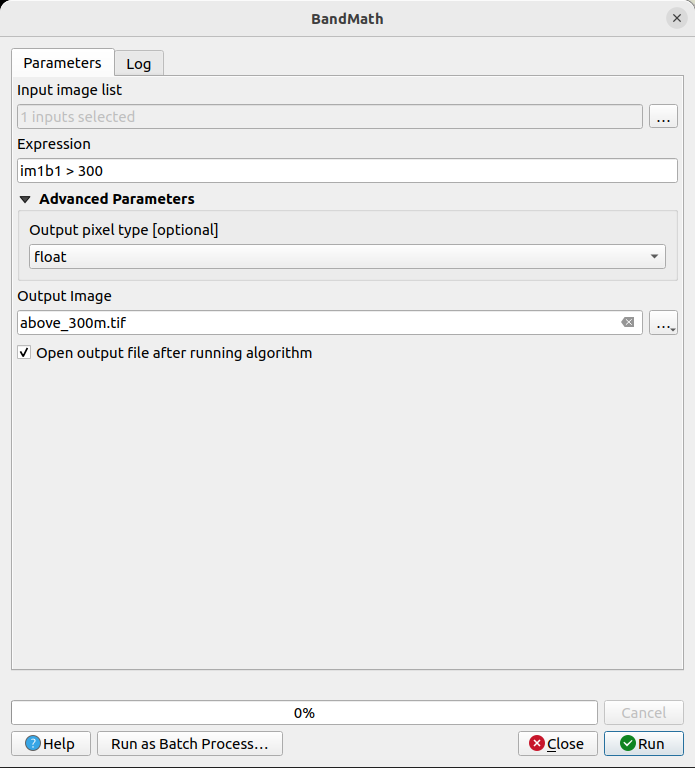
Finally click on run, the process will be executed and the image displayed.
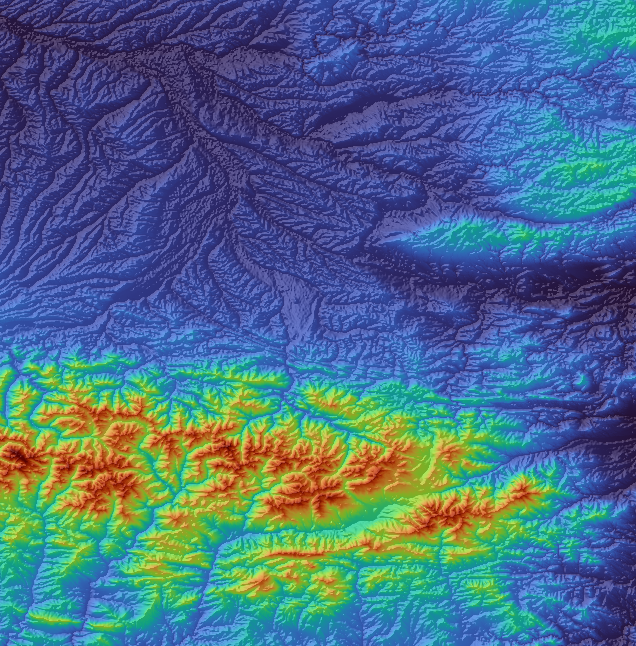
8 - Improve display of DEM
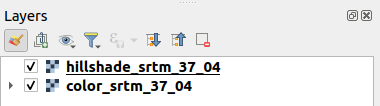
You can create a shadow effect with QGIS to design beautiful maps or improve visualization. Let's do this with an example based on a DEM. Open your favorite DEM source, duplicate it (right click on the layer and click on duplicate) and then name the top one "hillshade_X" and the second "color_X".
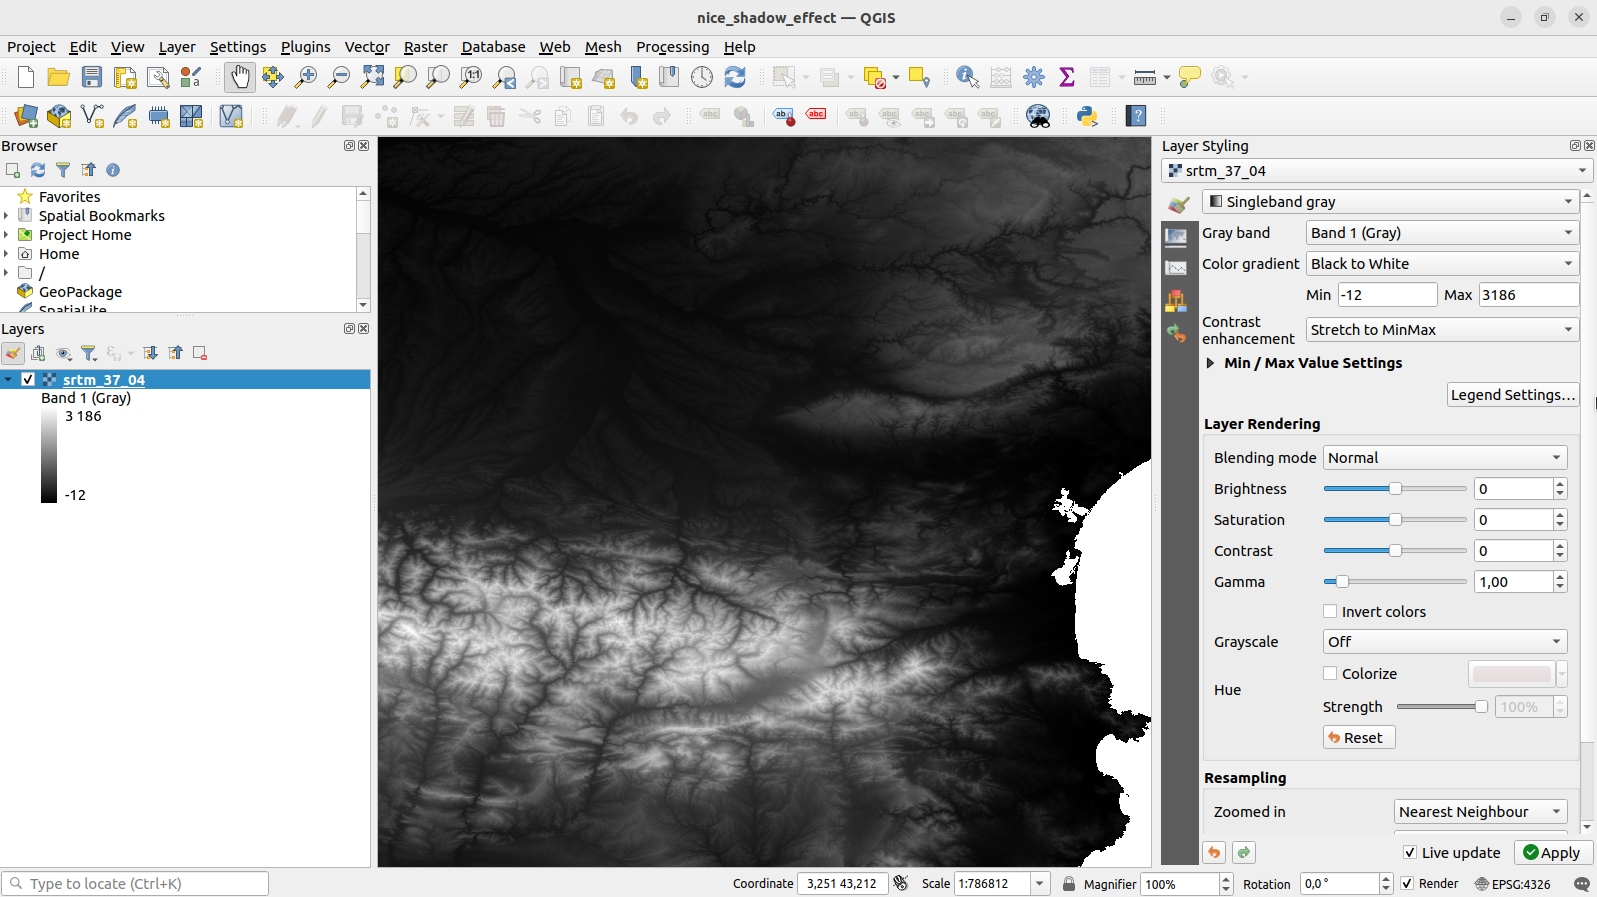
Click on the hillshade layer and go to the "Layer_styling" panel, on "Symbology" section : select "Hillshade" style.
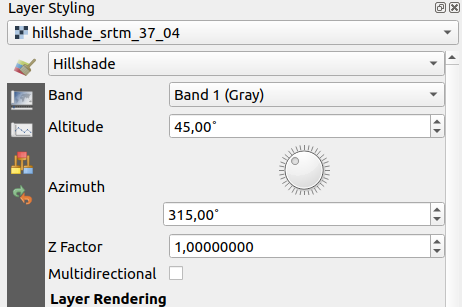
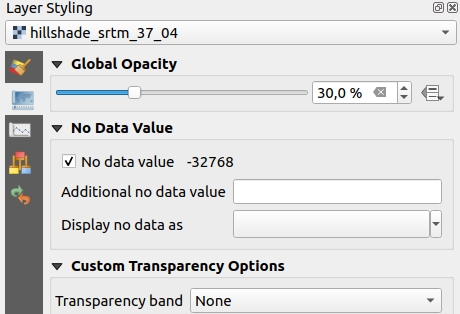
Change the opacity to 30% on the "Transparency" section.
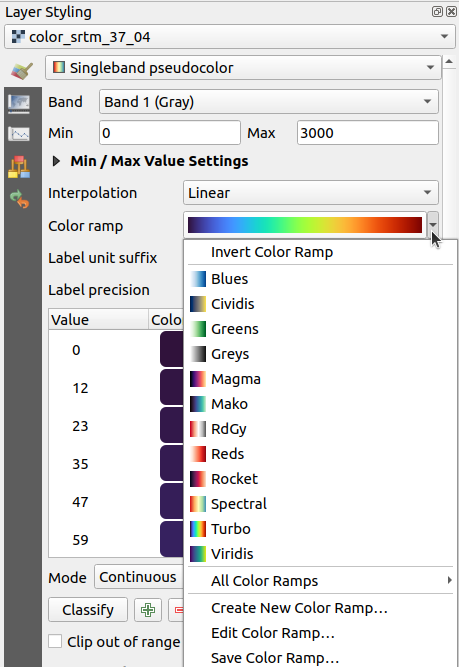
Click on the color layer and select "Singleband pseudocolor" style.
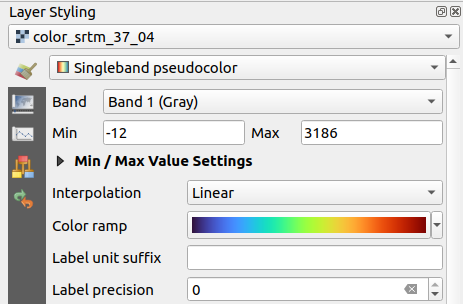
You have a lot of color ramp presets to play with.
A lot of parameters can be tuned to create beautiful map. Look at my beautiful DEM of the Pyrénées and Garonne basin:
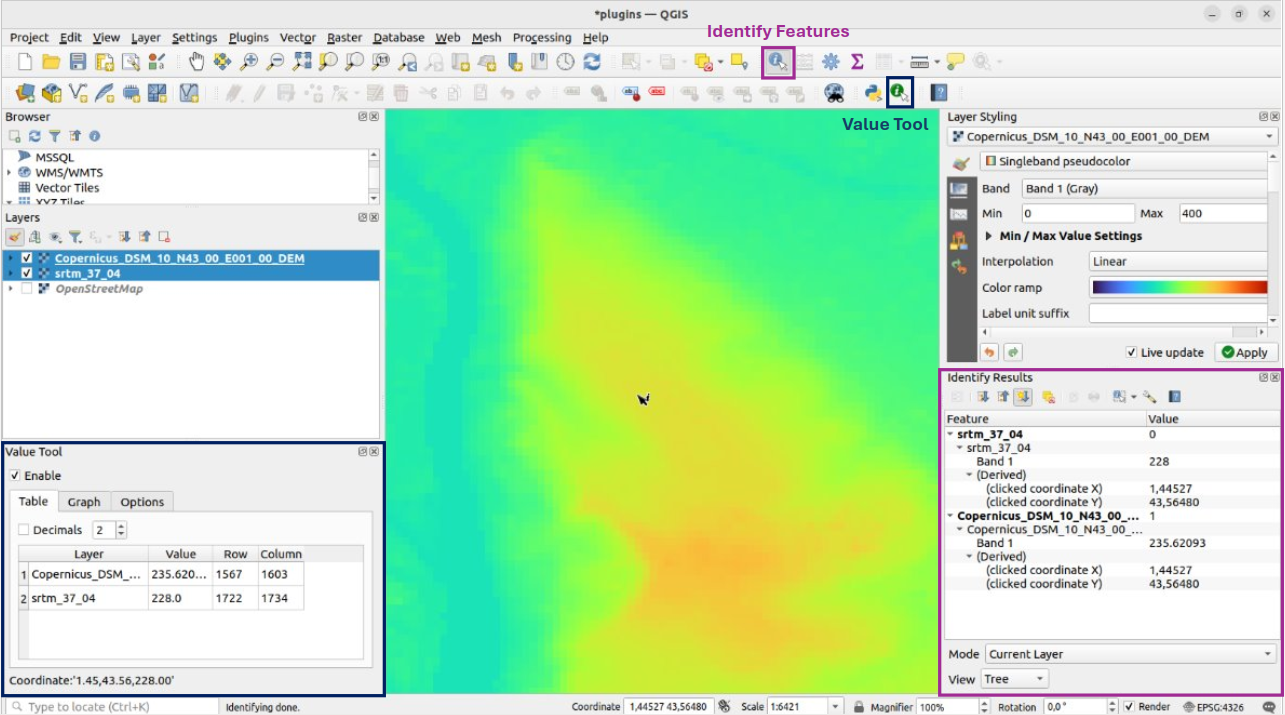
9 - See various layers value at the same time:
You may need to see simultaneously values of several layers to compare two dates, two bands ...
The QGIS Way :
Select the layers (hold Ctrl and click on the layers) and click on the "Identify Features" button or hit Ctrl+Shift+I. It will display values on the "Identify Results" panel, for each band of the selected layers. It also indicates the mouse clicked coordinate.
With the "Value tool" plugin :
The QGIS way is fine, but it can be improved. The Value Tool plugin (see tip V/ Install plugin) is an upgraded version of the "Identify Features" from QGIS.
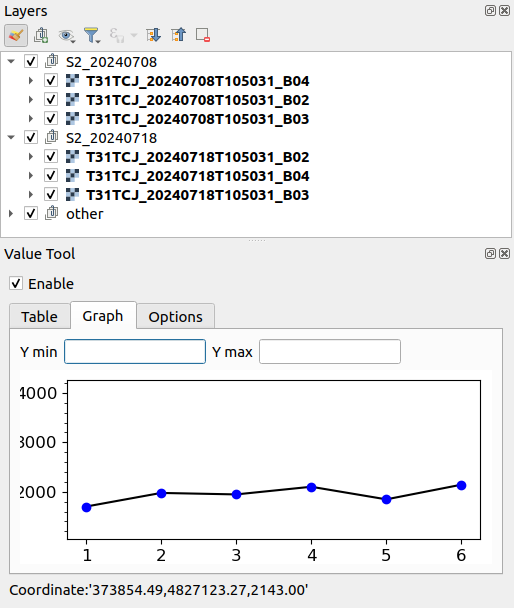
Click on the "Value Tool" button or go to "View" -> "Panels" to activate it. The "Value tool" panel displays value of layers at the current mouse location. It's easier to manipulate than the classic QGIS way. By default it will display all visible layers values but you can tune it in the "options" section. You have also a "Graph" section to visualize values of layers.
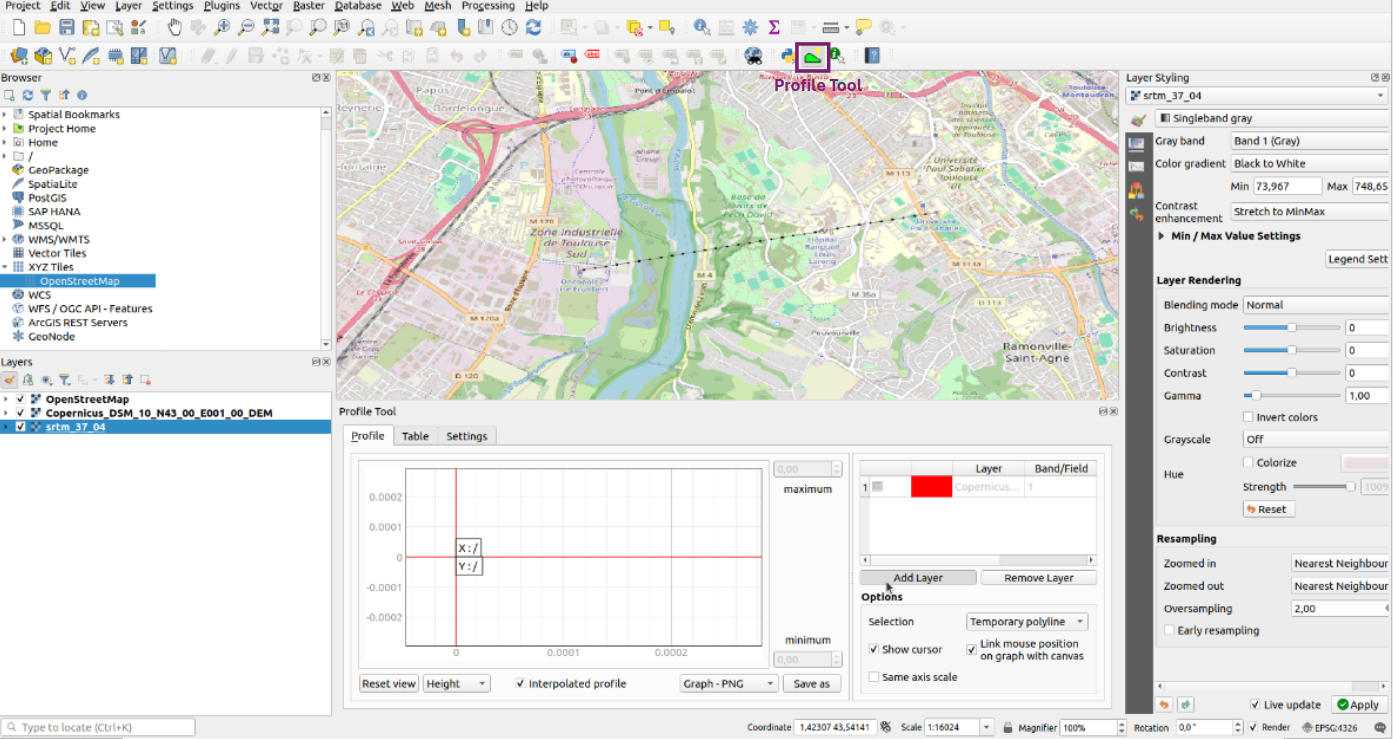
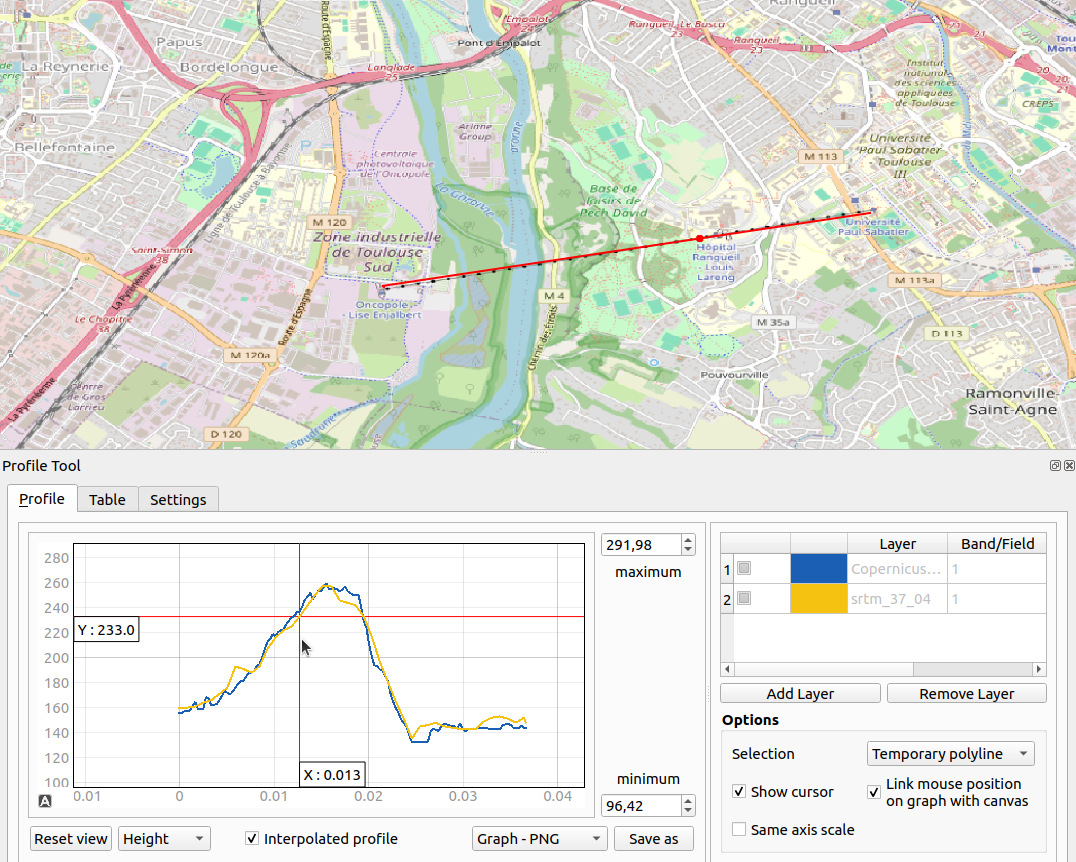
10 - See values across a poly-line with the "Profile tool" plugin
Profile tool plugin (see tip V/ Install plugin) allows you to plot profile lines from different raster layers like elevation field.
Click on the "Profile Tool" button or go to "View" -> "Panels" to activate the plugin.
The default window is "Profile" where you set up layers and see a graph of the profile you've created. On the "Table" window you will find the details of the profile as a table that can be exported.
In this example, let's compare the profiles of the aerial tramway of Toulouse on several DEM sources with OpenStreetLayer of Toulouse. We use a Copernicus DEM as previously, and SRTM in Toulouse, France.
For each layer we want to compute profile lines, let's select the layer and click on "Add Layer" in the Profile Tool panel. You can then change the color of each layer.
With the plugin activated, click on the canvas to draw lines and double click when you're done. Another click removes your lines and starts a new one.
Other tips are available for QGIS on PLUTO portal:
Contacts
Questions ? Get help on the Forum